|
Recently I've become really fascinated by the idea of manifold learning, the main idea behind it being that most data sets are actually too high-dimensional, and we can reduce the dimension of the data by viewing it as a manifold. Since I need to start preparing for a senior thesis, I decided that I want to try and implement some manifold learning techniques in order to better understand how all of it currently works. The simplest (at least at first glance to me) technique was called a "Self Organizing Map". Most C++ implementations of SOMs are restricted to two dimensions, and I wanted to understand SOMs for myself; so I decided to make my own. The current iteration of it is here.
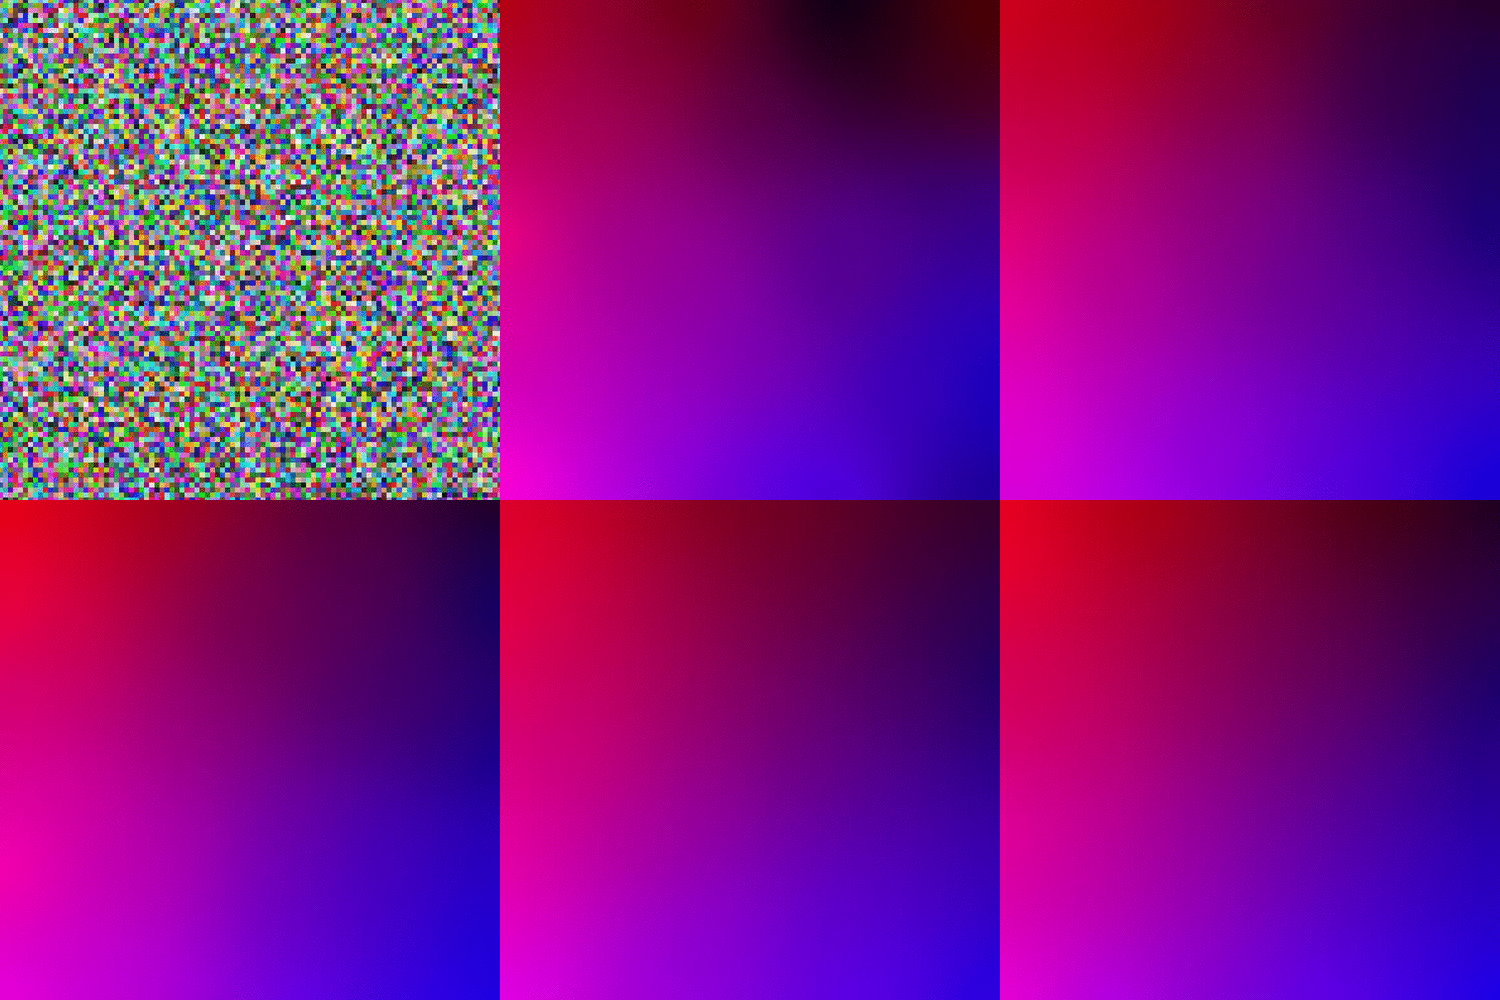
But what is a SOM? The idea with an SOM is that we start with a lattice of nodes in the dimension of our map (i.e. above we have a 2d lattice of nodes) and each node has a randomized image vector in the dimension of our data space. So in the color example above, we have our lattice of nodes (each represented by a pixel) which each has a 3 dimensional vector (represented by the color of the pixel). From there we train our map by dragging this lattice of nodes onto our data to form a manifold. How exactly we do that is via the below steps:
What does this look like though? Well, let's see the algorithm train. In the below example we are feeding the algorithm 5000 RGB values where the green component is set to 0. So we are approximating a plane with a plane. We then ran the algorithm over 3000 iterations on a lattice of 100 x 100 nodes. We can see how the algorithm starts with a noisy random plane and converges to a smooth plane approximating the dataset that we gave it. It's important to note that SOMs don't have to be planes. We can have a SOM line, something that approximates a path. (It is important to note though that SOMs don't preserve "orientation" of the data, the path generated by the SOM could go in any direction). So let's see it approximate a path. I generated a dataset of random points on a circle with a gaussian noise (mean 0.0, std. dev 0.1), and ran it through a 1d SOM to try and see how well we could approximate the circle. If we had no idea that the data was derived from a circle, then the approximation that we get from the SOM looks incredibly reasonable. It underestimates the data a little bit, and tends towards the center of the circle, but it definitely did a good job of approximating the arc of the circle.
Notable though, we end up with a horseshoe shape, not a circle, and that's due to a limitation of the model of our map space. We are mapping on the real line, so we don't get the nice looping effect of a circle. The end of our line is completely distinct from the start, whereas in a circle the end is the same as the start. It would be an interesting experiment to modify the SOM to instead of having our map space be an N-dimensional cube (as I currently have it implemented), to have it be an N-dimensional sphere. But all in all, this is an SOM, and I think it's pretty nifty.
0 Comments
Leave a Reply. |
AuthorHi, I'm Billy, a PhD student studying Math. Archives
January 2020
Categories
All
|


 RSS Feed